January 13, 2014
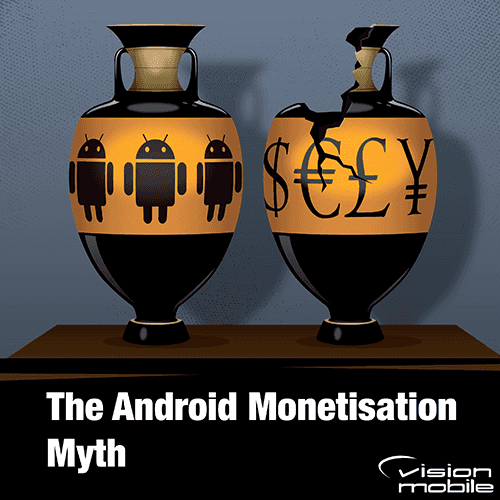
[tweetable]Revenues from Android apps saw tremendous growth in 2013[/tweetable]. If you look at the headline global figures then revenues from Android apps on Google Play are rapidly closing on those from iOS apps on the App Store. It looks extremely likely that 2014 is the year that Android will overtake iOS in total app revenues. However, dig a little deeper and you’ll find the distribution of revenues, both geographically and across apps is rather different. If you’re planning your platform strategy for this year then a dive into the details might prove invaluable.
Almost a year ago, I wrote about two important app market trends to watch in 2013, which were continued growth of app revenues (they’re still growing, Android significantly faster than iOS) and revenue distribution (it’s getting even more concentrated at the top). According to Distimo:
“On a typical day in November 2013, we estimate the global revenues for the top 200 grossing apps in the Apple App Store at over $18M. For Google Play, our estimate is about $12M. In November 2012, these estimates were at $15M for the Apple App Store and only at $3.5M for Google Play.”
That’s 20% annual growth at the top of the market for iOS and just over 240% annual growth for Android. Add to that there are also alternate stores for Android that have been growing revenues too. These figures and relative growth rates make it seem as if Android is the place to be in 2014. It might be, if you can make it to the very top. If we look at AppAnnie’s report for a similar period, they estimate that total iOS App Store revenues roughly doubled year over year*, while total Google Play revenues were a bit more than triple their year ago levels. So although Apple seems to be improving the revenue distribution slightly, it’s getting even more concentrated at the top of the market on Android.
Even the wider distribution of revenues on iOS may not be quite as good as it looks when we also consider geographic spread. Although the US is still the top revenue earner for iOS, the bulk of the growth is in Asia, particularly China and Japan. The top grossing charts in these countries look very different from the global top grossing apps and this may account for much of the widening range of high revenue apps. [tweetable]On Android, the bulk of the growth and total revenue is in Asia and thus so are the top grossing apps[/tweetable]. Japan has overtaken the US as the top revenue earning country for apps overall mostly due to growth on Android. The vast majority of the increased revenue is in free-to-play games and App Annie’s report shows that in Japan, almost all of this was attributable to just five publishers. Two of those publishers were existing major games powerhouses before the mobile era and they have several well known franchises. Two more reached the kind of scale where TV advertising became a viable route to market and exploded from there. The last of the five is LINE, who built a messaging platform with over 300 million users as a channel to promote their games.
This concentration of revenues amongst five publishers in Japan is mirrored elsewhere in the world. Consider Supercell (makers of Clash of Clans and Hay Day) were at $2.4M per day in revenues in April 2013, when they were still only publishing on iOS (they’ve since launched on Android) and were in the middle of expanding through Asia. That’s more than 10% of daily global App Store revenues for the top 200 grossing apps made by one publisher with 2 apps. Supercell aren’t unique either – according to Think Gaming’s estimates, King.com’s Candy Crush Saga is making more than $900k per day, just on iOS in the US. Indeed Think Gaming give us a better idea of the distribution. Their estimates show that the number 10 grossing game makes only a 10th as much as the top grossing game and by number 100 you’re down to nearly 100th of the revenue.
So, with revenue concentration at the top of the charts on Android even greater than on iOS, Android is the platform to target if you’ve got a world beating app with global appeal on your hands. Otherwise you’re almost certainly still better off on iOS first. Our own data, which considers revenue sources outside the app stores as well, agrees with this. If we only include the publishers earning less than $5M per month then iOS comes out on top, although if we include everyone with non-zero revenues then Android sneaks ahead. Significantly higher revenues for a tiny number of top Android developers pushes the average ahead of iOS (although the median remains way behind – there were more iOS than Android developers earning >$5M per month in our survey).
Android may become the top earning platform from App Stores in 2014 but it seems that only an elite few developers will reap the rewards. We’ve already shown that building enterprise apps and avoiding the app stores is a better bet financially but Android is not currently a lucrative platform in the enterprise market either. Still, it’s not all bad news for Android developers – the rising tide of revenues will lift all boats to some degree. Also, even 2014’s cheap Android device should be running at least Android 4.0 and have hardware capable of running almost any app well. This should reduce costs and increase the real addressable market for all Android developers. Last but not least, for an increasing number of developers [tweetable]it’s not a question of Android or iOS, it’s becoming ever more important to target both[/tweetable].
* Distimo’s year was November to November, while App Annie’s was October to October, so there may be some impacts from the relative timing of new product introductions.
Contact us
Swan Buildings (1st floor)20 Swan StreetManchester, M4 5JW+441612400603community@developernation.net

