March 06, 2020
Did you know that more developers are team players than loners? If you are like us, you probably love these kinds of facts. You can find more of these in our State of Developer Nation Report (SoN). This edition includes a chapter on Developer Psychographics.
The SoN report comes as a result of our Developer Economics surveys. These are answered annually by tens of thousands of developers, from all over the world. Therefore, these are some of the most reliable reports globally when it comes to developer trends.
The developer community is one of the most developing (see what I did there?) communities in the world. Changes are constant and sometimes, unpredictable. That is why our surveys are as inclusive and all-around as they can be, so that we don’t miss a single thing and we are always up to date.
Developer Psychographics: How do developers describe themselves?
This differs depending on their technology sector, their age and more. For instance, most developers see themselves as Logical persons. However, those working on game development see themselves mainly as Gamers (obviously).

Younger developers mainly see themselves as Gamers. On the other hand, those over 35 years old are more likely to self identify as Readers. In addition, “Gamers” are the least popular term amongst developers aged 45-54 years old.

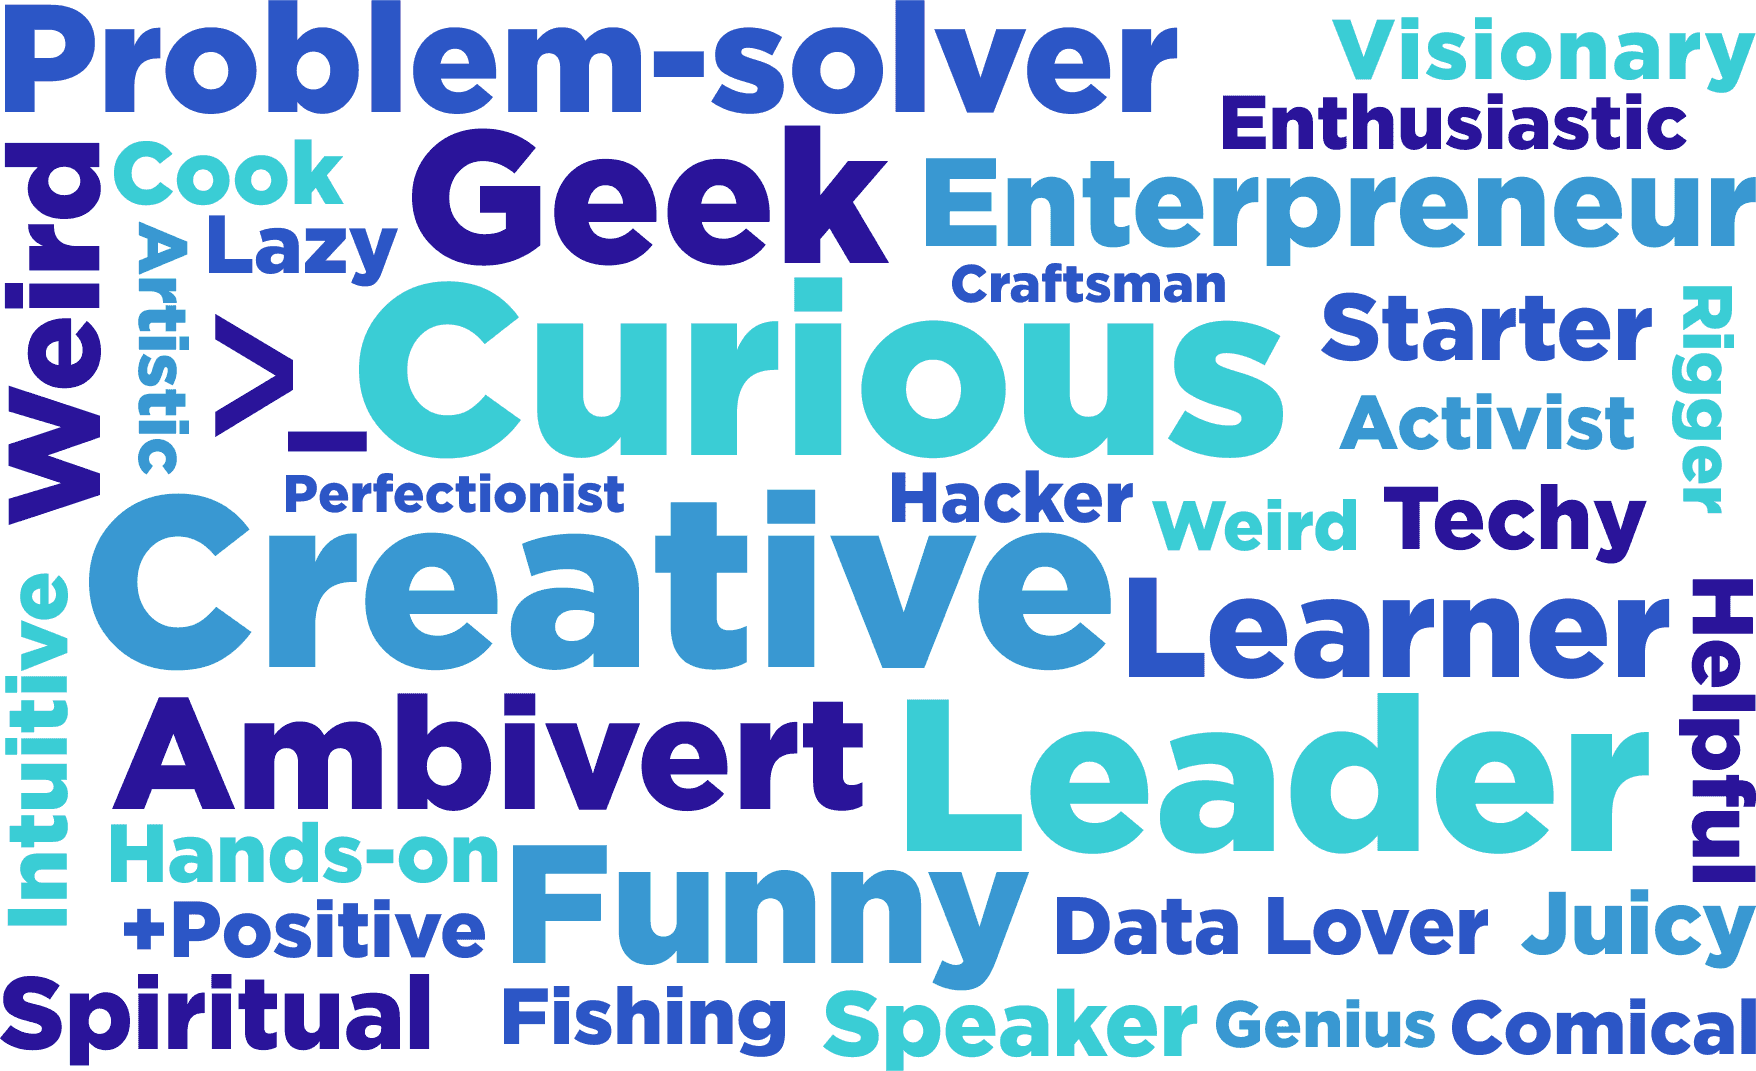
During the Developer Economics Q2 2019 Survey, we offered respondents over 20 words to create a word sketch that would best describe themselves. Participants could use up to five words and also provide their own descriptions in a text field. We received over 300 responses which ranged from “analytical” to “zoned out”.
It would seem that we are amongst some Curious, Enthusiastic, Friendly, Geeks, and the occasional Innovative, Lazy Leaders Developers.
A few developers pondered if we were asking these questions in an effort to set up a dating site (we are not!). Speaking of love, however, we found a few developers who love dancing, love the future, love puzzles and music.
Finally, we discovered that a lizard person had answered the survey.
This will surely help our research in years to come!

If you enjoyed this post, you can read the first part of our Developer Psychographics here: How developers see themselves . We also created a webinar on this topic, which is now available on YouTube. Check it out: Developer Personas and Psychographics.
The full State of the Developer Nation report, 17th Edition, with more interesting facts like these ones, is available here.
Join our community for more
Our next report will be out soon, including all the latest trends of the developer world. Why not sign up in our community and receive it right in your inbox?
Our Developer Economics newsletters are fortnightly, include useful developer resources and news, always start with dev humor and are 100% spam free.
Till our next survey!
Recent Posts

August 27, 2025
How to Find the Right Learning Path When You’re Switching to a Tech Career
See post

August 27, 2025
The Hidden Challenges in Software Development Projects: Key Insights from Our Latest Survey
See post

August 22, 2025
Developer News This Week: AI Speed Trap, GitHub Copilot Agents, iOS 26 Beta Updates & More (Aug 22, 2025)
See post